- ETH price declined steadily and recently revisited the $200 support level against the US Dollar.
- The price traded as low as $197 and spiked sharply above the $200 and $205 levels.
- There was a bre...
- ETH price declined steadily and recently revisited the $200 support level against the US Dollar.
- The price traded as low as $197 and spiked sharply above the $200 and $205 levels.
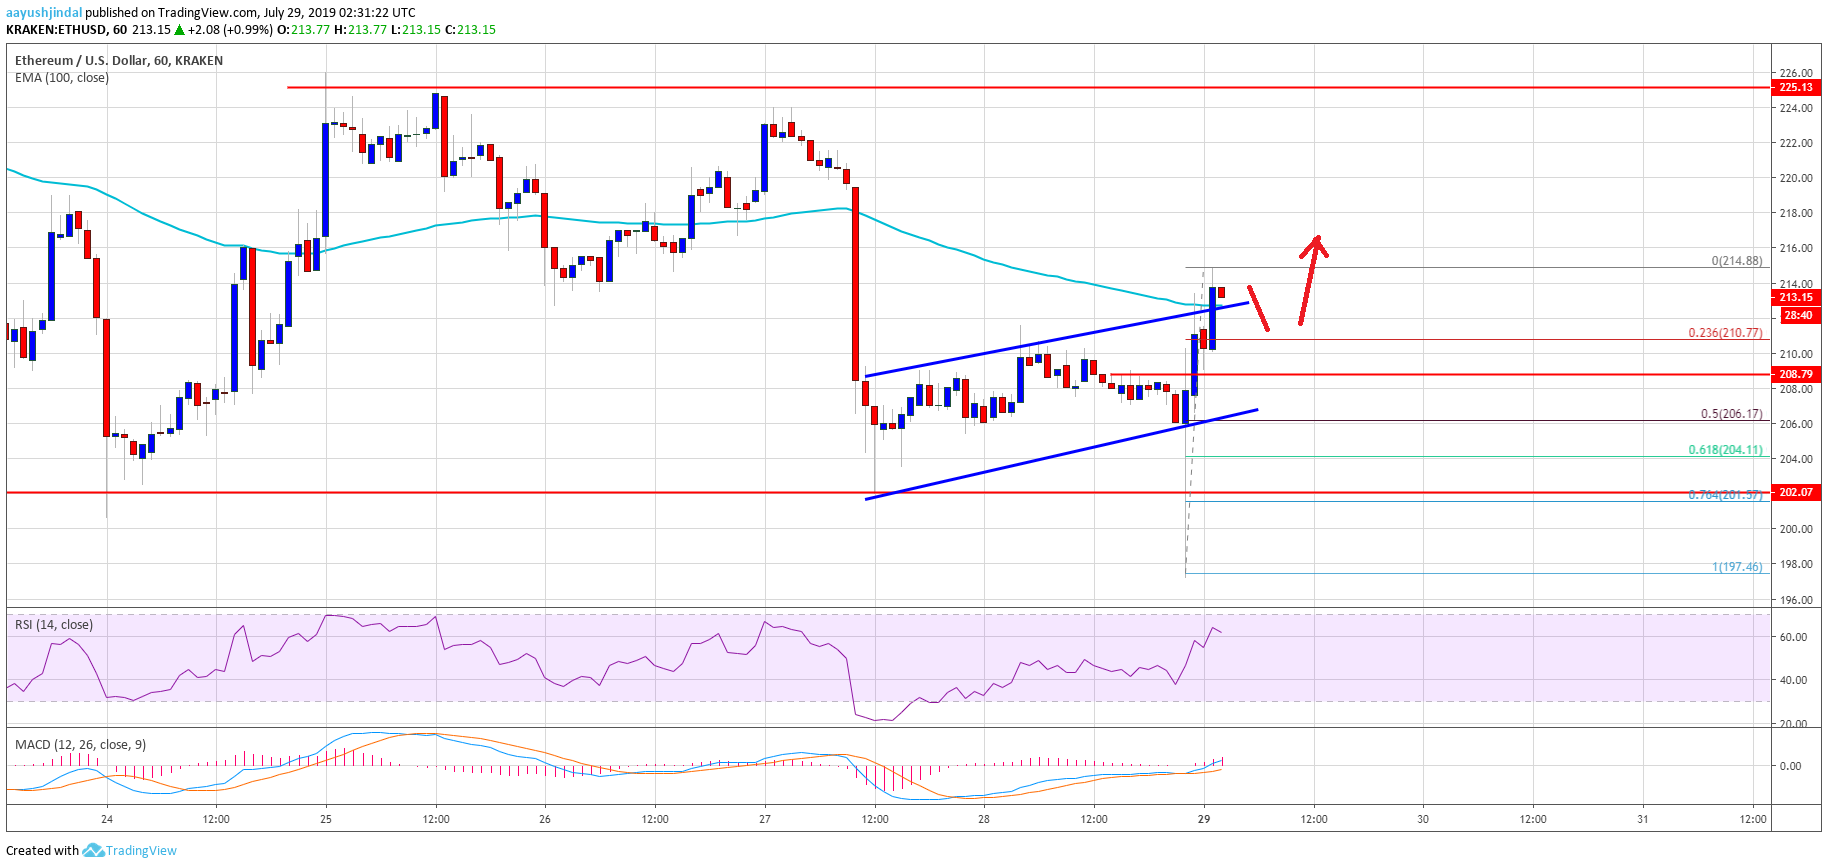
- There was a break above a short term ascending channel with resistance near $210 on the hourly chart of ETH/USD (data feed via Kraken).
- The pair might continue to recover, but it remains in a downtrend as long as below $225.
Ethereum price is currently correcting higher versus the US Dollar and bitcoin. ETH price might climb towards the $220 or $225 resistance where sellers are likely to take a stand.
Ethereum Price Analysis
In the past few days, there was a steady decline in Ethereum price from the $225 resistance against the US Dollar. The ETH/USD pair broke the $210 support level and the 100 hourly simple moving average. Finally, there was a spike below the main $200 support level and a new swing low was formed near $197. However, it seems like the bulls were able to protect the $200 support as the price recovered sharply above $205.
There was a solid recovery above the $205 and $210 resistance levels. Moreover, there was a break above a short term ascending channel with resistance near $210 on the hourly chart of ETH/USD. The pair is now trading above the $210 level and the 100 hourly simple moving average. An immediate support is near the broken channel at $211. Additionally, the 23.6% Fib retracement level of the recent wave from the $197 low to $215 swing high is also near the $210 level.
If the price continues to correct lower, the next support could be near the $206 level. The 50% Fib retracement level of the recent wave from the $197 low to $215 swing high is waiting near the $206 level to provide support. If the price slides below $205, the price is likely to move back towards $200.
On the upside, there are many important resistance levels near the $215, $220 and $225 levels. The main hurdle is near the $225 level, above which the price could turn positive in the coming days. If not, there is a risk of more losses below the $205 and $200 support levels.
Looking at the chart, Ethereum price is clearly correcting higher with a bullish angle above $210. However, this could turn out to be a false move until the bulls gather pace above $220 and $225.
ETH Technical Indicators
Hourly MACD – The MACD for ETH/USD is gaining momentum in the bullish zone.
Hourly RSI – The RSI for ETH/USD is currently climbing higher towards the 70 level.
Major Support Level – $205
Major Resistance Level – $220
The post Ethereum Price (ETH) Spiking Higher But Remains In Downtrend appeared first on NewsBTC.
source https://www.tokentalk.co/NewsBTC/ethereum-price-eth-spiking-higher-but-remains-in-downtrend-5d3e62207be5bcbd3bc16194
Sunday, 28 July 2019
Ethereum Price (ETH) Spiking Higher But Remains In Downtrend @newsbtc #Analysis #Technical #ETH #ethereum
Subscribe to:
Post Comments (Atom)
This analyst says there’s a “high chance” Bitcoin may never fall under $5k again @cryptoslate #Analysis #Price Watch
Once Bitcoin (BTC) started to incur strong losses in the second half of 2019, analysts were once again making extremely low price prediction...

-
The Indian Ministry of Commerce and Industry announced yesterday that the Coffee Board in the country is integrating blockchain into the cof...
-
App-enabled cryptocurrency exchange and wallet provider, Zebpay, has announced that it is enabling Lightning Network payments for all its ...
-
Disclaimer: These summaries are provided for educational purposes only by Nelson Rosario and Stephen Palley... Disclaimer: These summaries...

No comments:
Post a Comment