- Bitcoin price climbed higher recently and broke the $10,000 resistance area against the US Dollar.
- The price retested the $10,200 resistance area and it is currently correcting lower.
- There was a...
- Bitcoin price climbed higher recently and broke the $10,000 resistance area against the US Dollar.
- The price retested the $10,200 resistance area and it is currently correcting lower.
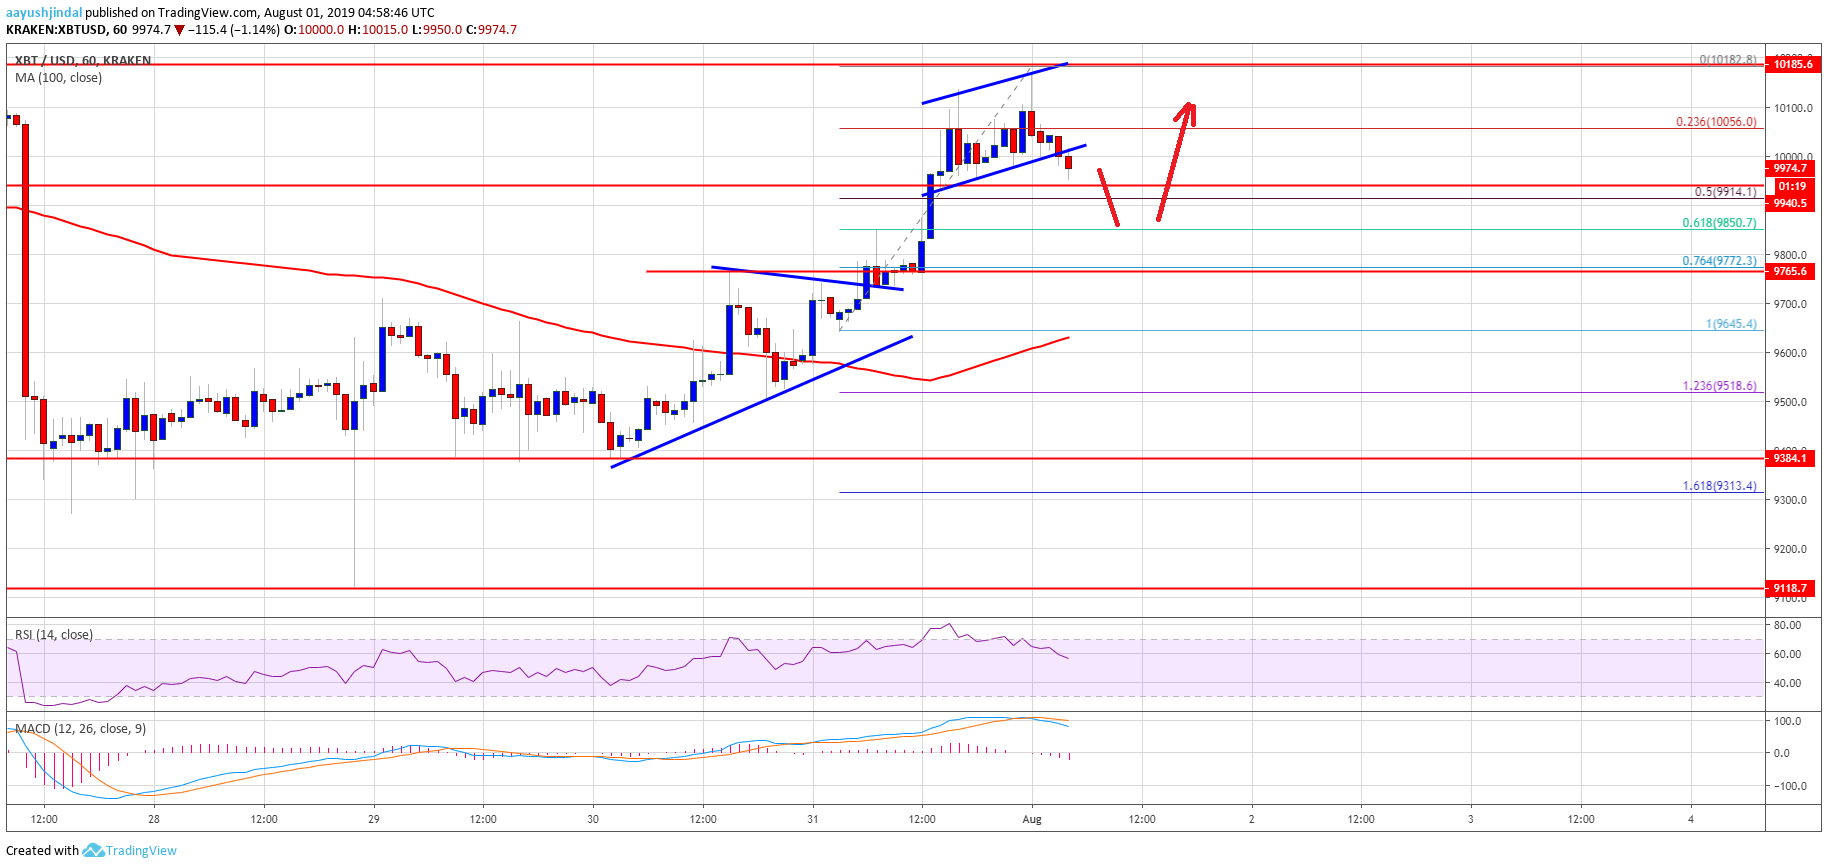
- There was a break below a short term ascending channel with support near $10,020 on the hourly chart of the BTC/USD pair (data feed from Kraken).
- The price is currently correcting lower, but dips remain supported near the $9,850 and $9,800 levels.
Recently, there was a nice upward move in bitcoin price above $10,000 against the US Dollar. BTC price retested the main $10,200 resistance level and it is currently correcting gains.
Bitcoin Price Analysis
Yesterday, we discussed the chances of more upsides in bitcoin price above $10,000 against the US Dollar. The BTC/USD pair did gain momentum above the $9,800 resistance and the 100 hourly simple moving average. Moreover, the pair broke the $10,000 resistance level and revisited the $10,200 resistance. A swing high was formed near $10,182 and the price is currently correcting lower.
It traded below $10,100 plus the 23% Fib retracement level of the recent rise from the $9,645 low to $10,182 high. Moreover, there was a break below a short term ascending channel with support near $10,020 on the hourly chart of the BTC/USD pair. The pair is now trading near the $10,000 level, with an immediate support near the $9,940 level. Additionally, the next key support is near $9,910 plus the 50% Fib retracement level of the recent rise from the $9,645 low to $10,182 high.
The main support is near the $9,850 level. If there is a downside break below the $9,850 support, the price could revisit the $9,650 level. The 100 hourly SMA is also waiting near the $9,640 level. Any further losses might push the price towards the $9,300 zone. It represents the 1.236 Fib extension level of the recent rise from the $9,645 low to $10,182 high.
On the upside, an immediate resistance is near the $10,050 level, above which the price is likely to retest the $10,200 resistance level. Therefore, the bulls need to gain strength above the $10,180 and $10,200 resistance levels in the near term for further gains.
Looking at the chart, bitcoin price is clearly trading with a positive bias above the $9,900 and $9,850 levels. Conversely, if there is a fresh decline, the bulls are likely to protect the $9,640 support level. On the upside, a clear break above $10,200 will most likely set the pace for a move towards $10,500.
Technical indicators:
Hourly MACD – The MACD is slowly gaining pace in the bearish zone.
Hourly RSI (Relative Strength Index) – The RSI for BTC/USD is currently declining lower towards the 50 level.
Major Support Levels – $9,910 followed by $9,850.
Major Resistance Levels – $10,050, $10,200 and $10,500.
The post Bitcoin Price (BTC/USD) Correcting Gains, Dips Remain Supported appeared first on NewsBTC.
source https://www.tokentalk.co/NewsBTC/bitcoin-price-btcusd-correcting-gains-dips-remain-supported-5d427ef1f4c85eab76fc980b
Wednesday, 31 July 2019
Bitcoin Price (BTC/USD) Correcting Gains, Dips Remain Supported @newsbtc #Analysis #Technical #bitcoin #btc
Subscribe to:
Post Comments (Atom)
This analyst says there’s a “high chance” Bitcoin may never fall under $5k again @cryptoslate #Analysis #Price Watch
Once Bitcoin (BTC) started to incur strong losses in the second half of 2019, analysts were once again making extremely low price prediction...

-
The Indian Ministry of Commerce and Industry announced yesterday that the Coffee Board in the country is integrating blockchain into the cof...
-
App-enabled cryptocurrency exchange and wallet provider, Zebpay, has announced that it is enabling Lightning Network payments for all its ...
-
Disclaimer: These summaries are provided for educational purposes only by Nelson Rosario and Stephen Palley... Disclaimer: These summaries...

No comments:
Post a Comment