- ETH price started a strong recovery after trading towards the $200 support level against the US Dollar.
- The price gained more than 5% and broke the $210 and $215 resistance levels.
- Yesterday’s hi...
- ETH price started a strong recovery after trading towards the $200 support level against the US Dollar.
- The price gained more than 5% and broke the $210 and $215 resistance levels.
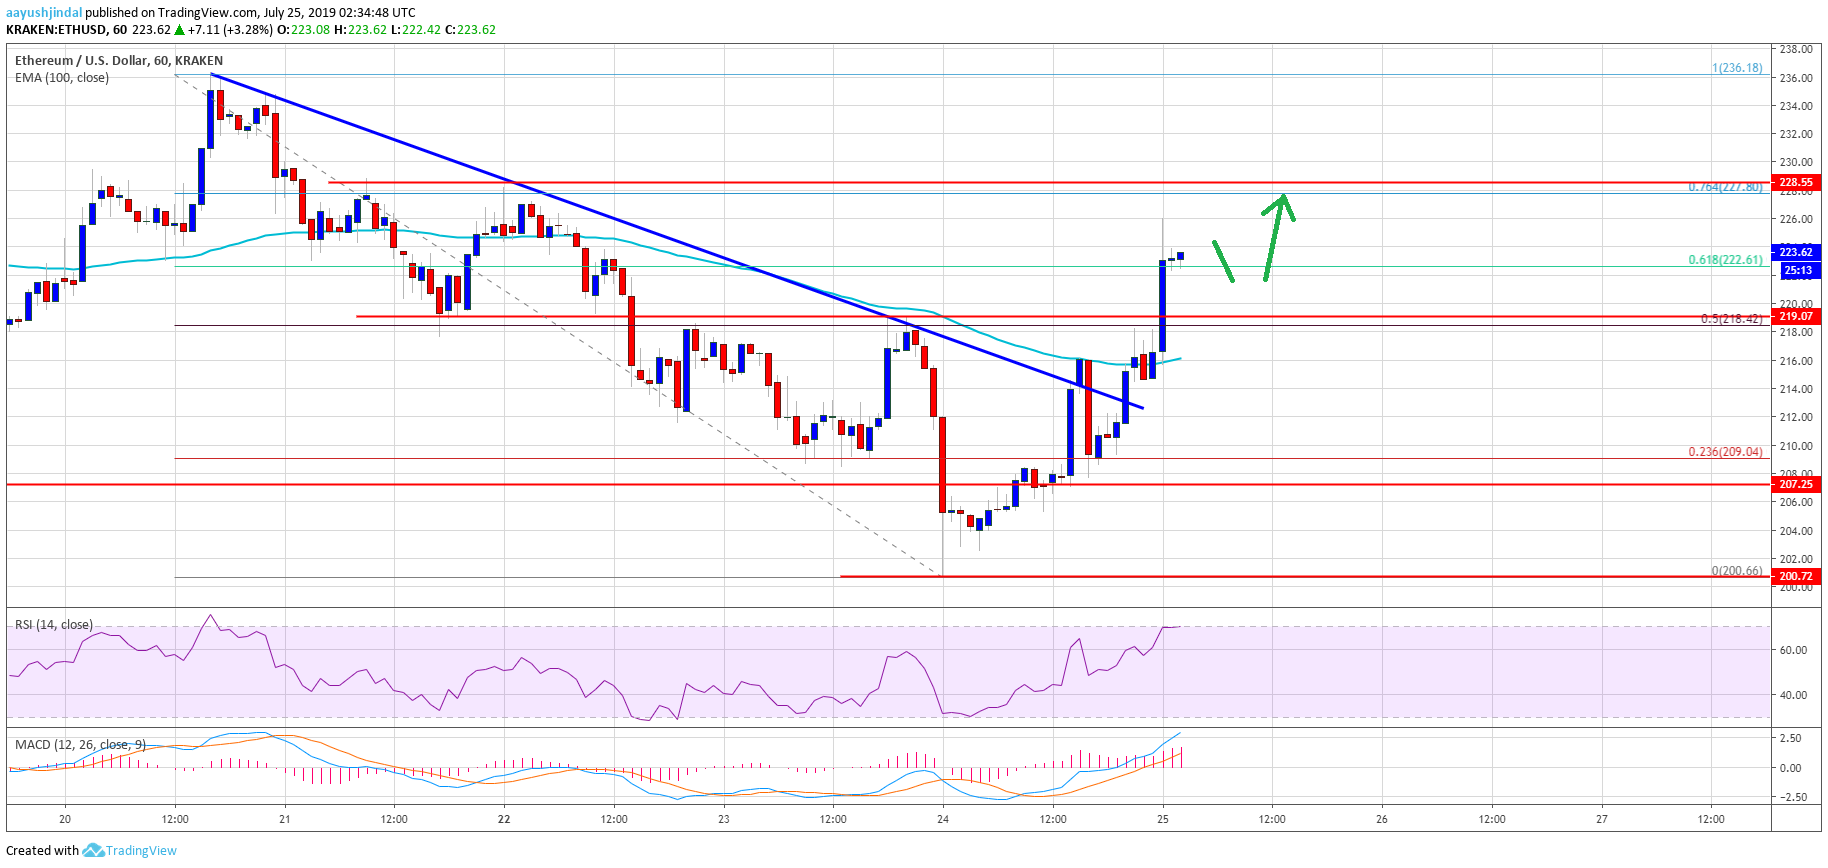
- Yesterday’s highlighted key bearish trend line was breached with resistance near $212 on the hourly chart of ETH/USD (data feed via Kraken).
- The pair is showing positive signs and it seems like it could revisit the $230 and $235 resistance levels.
Ethereum price is showing reversal signs above $215 versus the US Dollar, similar to bitcoin. ETH price is likely to continue higher and dips towards $218 likely remains supported.
Ethereum Price Analysis
Yesterday, we saw a downside extension in Ethereum price below $210 against the US Dollar. The ETH/USD pair even broke the $205 level and tested the $200 support level. The bulls managed to defend the $200 handle and the price started a decent recovery. There was a break above the $210 and $215 resistance levels to start the current upward move. Moreover, the price even surpassed the $220 resistance and the 100 hourly simple moving average.
Besides, yesterday’s highlighted key bearish trend line was breached with resistance near $212 on the hourly chart of ETH/USD. The pair is now trading nicely above the 50% Fib retracement level of the downward move from the $236 high to $200 low. The current price action indicates the chances of more gains above the $225 level in the near term.
An immediate resistance is near the $228-230 zone. Moreover, the 76.4% Fib retracement level of the downward move from the $236 high to $200 low is likely to act as a resistance near $228. If there are more gains above $228 and $230, the price could continue to rise. The next stop for the bulls could be near the $236 swing high.
On the other hand, if the price corrects lower, it might find bids near the $220 support. Additionally, the $218 level and the 100 hourly SMA are also strong supports. As long as the price is trading above the 100 hourly, it is likely to break the $228 and $230 resistance levels.
Looking at the chart, Ethereum price is showing a lot of positive signs above the $218 level. The technical structure is positive, suggesting more upsides above $230. Only a close below $216 and the 100 hourly SMA might negate the current bullish view in the near term.
ETH Technical Indicators
Hourly MACD – The MACD for ETH/USD is gaining momentum in the bullish zone, with positive signs.
Hourly RSI – The RSI for ETH/USD is gaining pace towards 80 and it is currently well above the 60 level.
Major Support Level – $216
Major Resistance Level – $230
The post Ethereum Price (ETH) Reverses Sharply, Bitcoin Jumps 5% appeared first on NewsBTC.
source https://www.tokentalk.co/NewsBTC/ethereum-price-eth-reverses-sharply-bitcoin-jumps-5-5d391c214a4cf805082ee434
Wednesday, 24 July 2019
Ethereum Price (ETH) Reverses Sharply, Bitcoin Jumps 5% @newsbtc #Analysis #Technical #ETH #ethereum
Subscribe to:
Post Comments (Atom)
This analyst says there’s a “high chance” Bitcoin may never fall under $5k again @cryptoslate #Analysis #Price Watch
Once Bitcoin (BTC) started to incur strong losses in the second half of 2019, analysts were once again making extremely low price prediction...

-
The Indian Ministry of Commerce and Industry announced yesterday that the Coffee Board in the country is integrating blockchain into the cof...
-
App-enabled cryptocurrency exchange and wallet provider, Zebpay, has announced that it is enabling Lightning Network payments for all its ...
-
Once Bitcoin (BTC) started to incur strong losses in the second half of 2019, analysts were once again making extremely low price prediction...


No comments:
Post a Comment