- Ripple price failed to hold the key $0.3250 support level and recently declined against the US dollar.
- The price even broke the $0.3200 support level to move into a short term bearish zone.
- Yeste...
- Ripple price failed to hold the key $0.3250 support level and recently declined against the US dollar.
- The price even broke the $0.3200 support level to move into a short term bearish zone.
- Yesterday’s highlighted major bullish trend line was breached with support at $0.3260 on the hourly chart of the XRP/USD pair (data source from Kraken).
- The price could extend the current decline and it might test the $0.3100 or $0.3000 support area.
Ripple price is currently trading below an important support against the US Dollar and bitcoin. XRP price might soon revisit the $0.3000 support area before starting a fresh rise.
Ripple Price Analysis
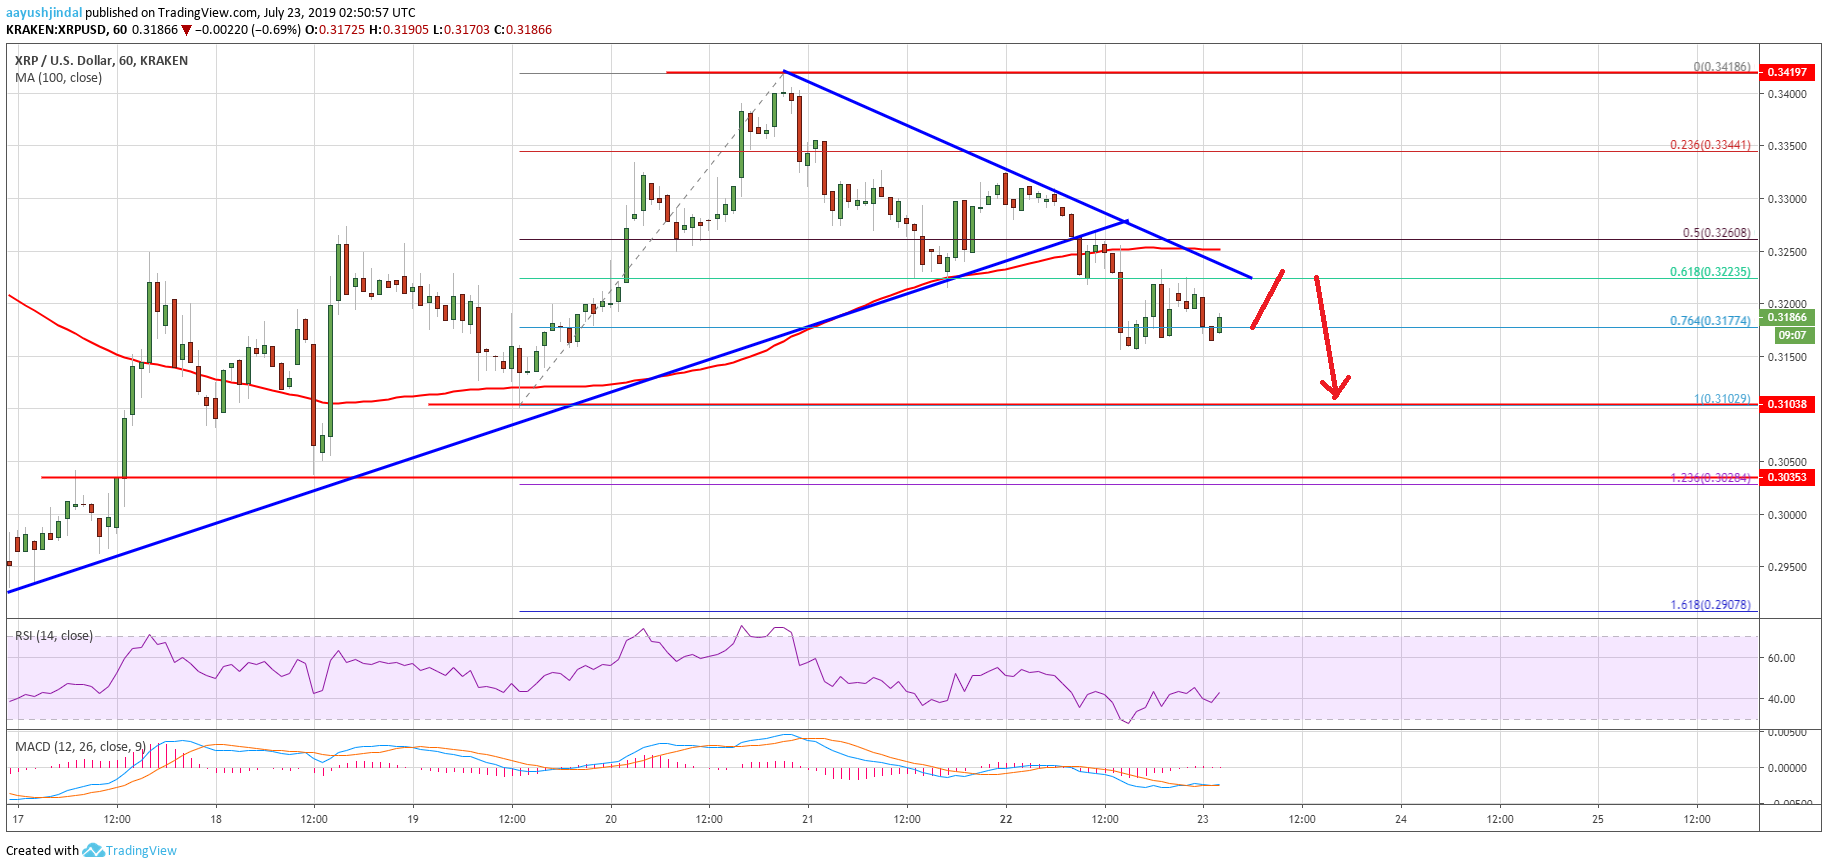
Recently, we saw a decent rise in ripple price above the $0.3250 and $0.3320 resistances against the US Dollar. The XRP/USD pair even spiked above the $0.3400 level and settled above the 100 hourly simple moving average. A swing high was formed near $0.3418 and the price started a downside correction. It broke the $0.3320 support level to start the current bearish wave.
Moreover, the price failed to hold the key $0.3250 support level. As a result, there was a bearish break below $0.3250 and $0.3240. The price traded below the 61.8% Fib retracement level of the upside move from the $0.3100 swing low to $0.3418 high. Additionally, yesterday’s highlighted major bullish trend line was breached with support at $0.3260 on the hourly chart of the XRP/USD pair.
It opened the doors for more losses below the $0.3200 support. At the outset, the price is trading near the 76.4% Fib retracement level of the upside move from the $0.3100 swing low to $0.3418 high. Therefore, there is a risk of more losses below the $0.3150 support level. The next support is near the $0.3100 level, below which the price could decline towards the main $0.3000 support area.
On the upside, the recent supports near $0.3250 might act as a resistance. There is also a connecting bearish trend line forming with resistance near $0.3225 on the same chart. More importantly, the 100 hourly SMA is positioned near the $0.3255 level. Therefore, a successful break above $0.3260 and the 100 hourly SMA is needed for a fresh increase.
Looking at the chart, ripple price is showing bearish signs below the $0.3250 support. Overall, as long as the price is trading below $0.3250 and $0.3260, there are chances of a downside extension below $0.3100 in the near term.
Technical Indicators
Hourly MACD – The MACD for XRP/USD is slowly losing momentum in the bullish zone.
Hourly RSI (Relative Strength Index) – The RSI for XRP/USD is now well below the 50 level.
Major Support Levels – $0.3150, $0.3100 and $0.3030.
Major Resistance Levels – $0.3225, $0.3250 and $0.3260.
The post Ripple Price (XRP) Could Retest $0.3000 Before Fresh Rise appeared first on NewsBTC.
source https://www.tokentalk.co/NewsBTC/ripple-price-xrp-could-retest-03000-before-fresh-rise-5d3687312420c2902090ffc3
Monday, 22 July 2019
Ripple Price (XRP) Could Retest $0.3000 Before Fresh Rise @newsbtc #Analysis #Technical #Ripple #xrp
Subscribe to:
Post Comments (Atom)
This analyst says there’s a “high chance” Bitcoin may never fall under $5k again @cryptoslate #Analysis #Price Watch
Once Bitcoin (BTC) started to incur strong losses in the second half of 2019, analysts were once again making extremely low price prediction...

-
The Indian Ministry of Commerce and Industry announced yesterday that the Coffee Board in the country is integrating blockchain into the cof...
-
App-enabled cryptocurrency exchange and wallet provider, Zebpay, has announced that it is enabling Lightning Network payments for all its ...
-
Once Bitcoin (BTC) started to incur strong losses in the second half of 2019, analysts were once again making extremely low price prediction...


No comments:
Post a Comment