- There were sharp gains in BTC to USD above the $10,000 level against the US Dollar.
- The price traded to a new 2019 high above the $11,000 level at $11,234.
- There is a key bullish trend line formi...
- There were sharp gains in BTC to USD above the $10,000 level against the US Dollar.
- The price traded to a new 2019 high above the $11,000 level at $11,234.
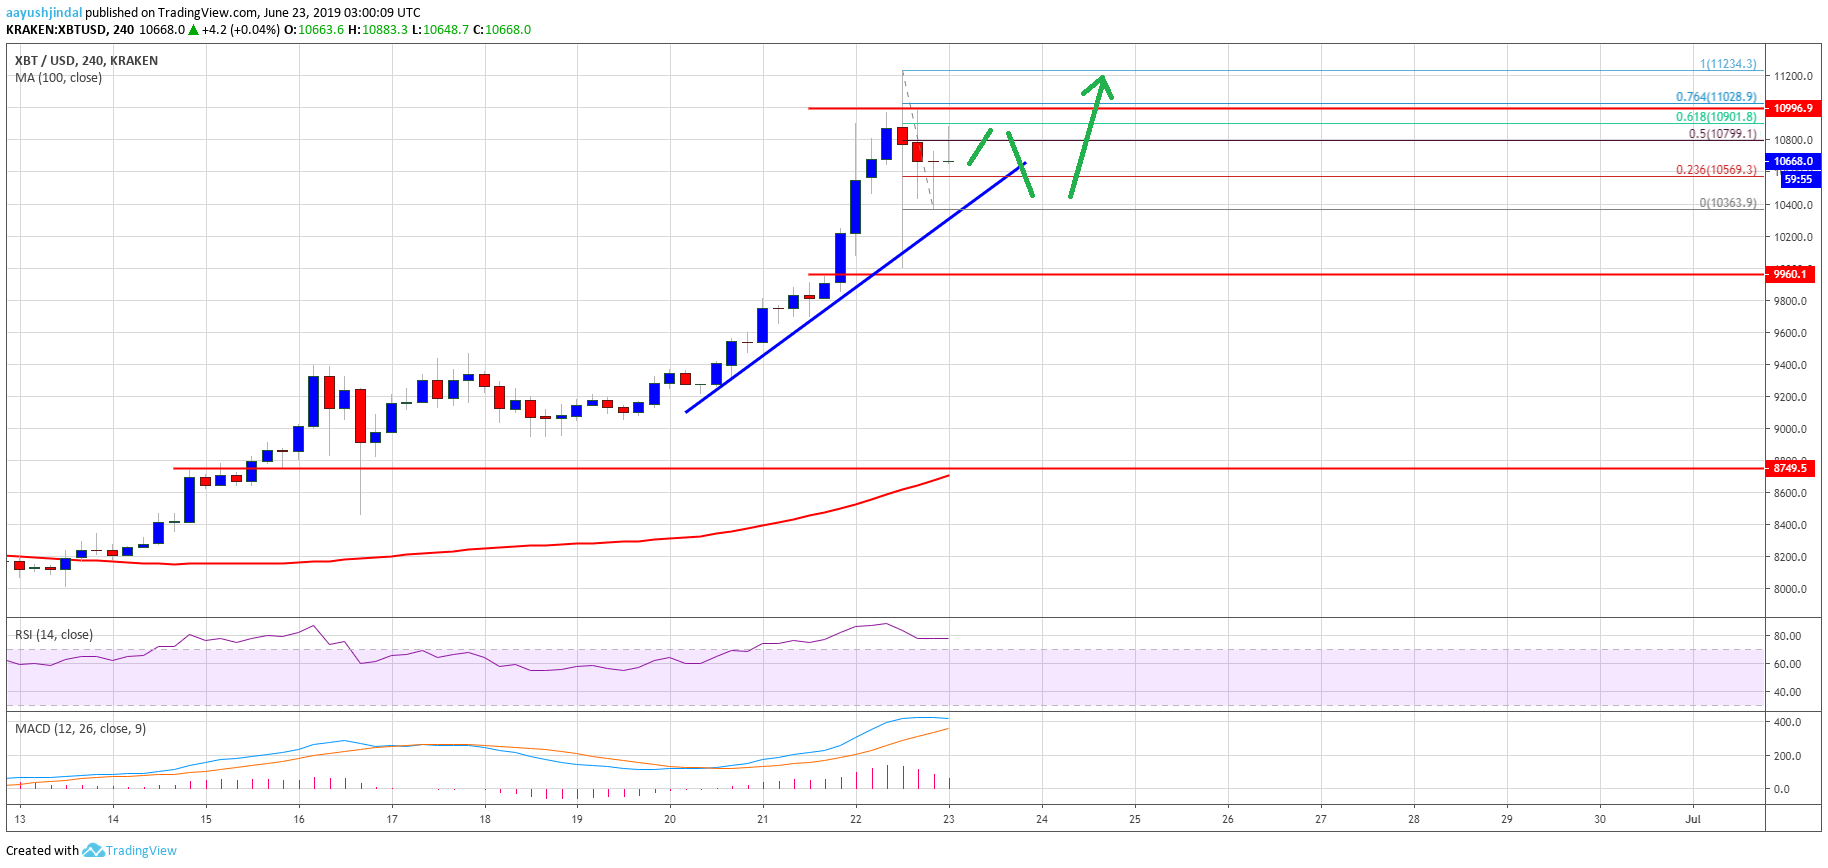
- There is a key bullish trend line forming with support near $10,550 on the 4-hours chart of the BTC/USD pair (data feed from Kraken).
- The pair is currently trading above the $9,000 level and it could continue higher towards the $10,000 level.
Bitcoin price is surging and it recently topped near the $11,200 level against the US Dollar. BTC could consolidate in the short term before a fresh increase above $11,000.
Bitcoin Price Weekly Analysis (BTC)
This past week, bitcoin price started a strong rally above the $8,500 and $9,000 resistances against the US Dollar. The BTC/USD pair even gained strength above the $10,000 and $10,500 levels. Finally, there was a break above the $11,000 level and the price settled well above the 100 simple moving average (4-hours). Finally, the price formed a new 2019 high near $11,200 and recently started a downside correction.
It declined below $11,000 and $10,800. However, the $10,400 level acted as a decent support and a swing low was formed at $10,363. The price is currently moving higher and it trading near the $10,700 level. It is above the 23.6% Fib retracement level of the recent correction from the $11,234 high to $10,363 low. However, it seems like the $10,800 and $10,950 levels are currently capping gains.
The 50% Fib retracement level of the recent correction from the $11,234 high to $10,363 low is also preventing gains. If there is a successful break above $10,950 and a follow through above $11,000, the price is likely to resume its uptrend. The next key resistances are near $11,200 and $11,500. If bitcoin price continues to rise, it could even test the key $12,000 level in the near term.
On the downside, there are many supports near $10,500. Moreover, there is a key bullish trend line forming with support near $10,550 on the 4-hours chart of the BTC/USD pair. If bitcoin slides below the trend line, it could revisit the $10,200 and $10,000 support levels.
Looking at the chart, bitcoin price seems to be currently correcting gains. It remains well supported above $10,000 and there are chances of a fresh increase above $11,000. The bulls are likely to target further gains and just like the 2017 bull-run, the price might soon accelerate above $11,200.
Technical indicators
4 hours MACD – The MACD for BTC/USD is slowly reducing its bullish slope.
4 hours RSI (Relative Strength Index) – The RSI for BTC/USD is currently in the overbought zone, with a few bearish signs.
Major Support Level – $10,500
Major Resistance Level – $11,000
The post Bitcoin (BTC) Price Tops $11.2K, Short Term Correction Before Higher appeared first on NewsBTC.
source https://www.tokentalk.co/NewsBTC/bitcoin-btc-price-tops-112k-short-term-correction-before-higher-5d0efb218988f0e31d56a67b
Saturday, 22 June 2019
Bitcoin (BTC) Price Tops $11.2K, Short Term Correction Before Higher @newsbtc #Analysis #Technical #bitcoin #btc
Subscribe to:
Post Comments (Atom)
This analyst says there’s a “high chance” Bitcoin may never fall under $5k again @cryptoslate #Analysis #Price Watch
Once Bitcoin (BTC) started to incur strong losses in the second half of 2019, analysts were once again making extremely low price prediction...

-
The Indian Ministry of Commerce and Industry announced yesterday that the Coffee Board in the country is integrating blockchain into the cof...
-
App-enabled cryptocurrency exchange and wallet provider, Zebpay, has announced that it is enabling Lightning Network payments for all its ...
-
Once Bitcoin (BTC) started to incur strong losses in the second half of 2019, analysts were once again making extremely low price prediction...


No comments:
Post a Comment