- ETH price recovered nicely after declining towards the $240 support area against the US Dollar.
- The price traded above the $270 level, but it seems to be struggling near $278 and $280.
- There is a...
- ETH price recovered nicely after declining towards the $240 support area against the US Dollar.
- The price traded above the $270 level, but it seems to be struggling near $278 and $280.
- There is a short term breakout pattern forming with resistance near $270 on the 4-hours chart of ETH/USD (data feed via Kraken).
- The pair remains well supported on dips as long as there is no close below the $250 support area.
Ethereum price jumped back after correcting sharply versus the US Dollar, similar to bitcoin. ETH must gain momentum above $270 and $280 to continue higher.
Ethereum Price Weekly Analysis
This past week, Ethereum price remained in a positive zone and traded above the $270 level against the US Dollar. The ETH/USD pair even broke the $280 level and settled above the 100 simple moving average (4-hours). The price traded as high as $289.01 before it corrected lower significantly. There was a downside break below the $264 and $250 support levels. The price even tested the $240 support and spiked below the 100 simple moving average (4-hours).
However, there was no close below the 100 simple moving average (4-hours) and the price recovered above the $250 level. There was a break above the $260 level, and the 50% Fib retracement level of the last decline from the $289 swing high to $239 swing low. The bulls managed to push the price above the $270 level, but it seems to be struggling near the $278 and $280 levels. The 76.4% Fib retracement level of the last decline from the $289 swing high to $239 swing low is also acting as a hurdle for the bulls.
At the moment, there is a short term breakout pattern forming with resistance near $270 on the 4-hours chart of ETH/USD. If there is an upside break above the triangle resistance, the price could move above $275. However, the price must gain pace above the $280 level to continue higher. On the downside, if the price breaks the $260 support, it could decline again. The main support is near the $250 level and the 100 SMA. If there is a close below the 100 SMA, the price might decline below $240.
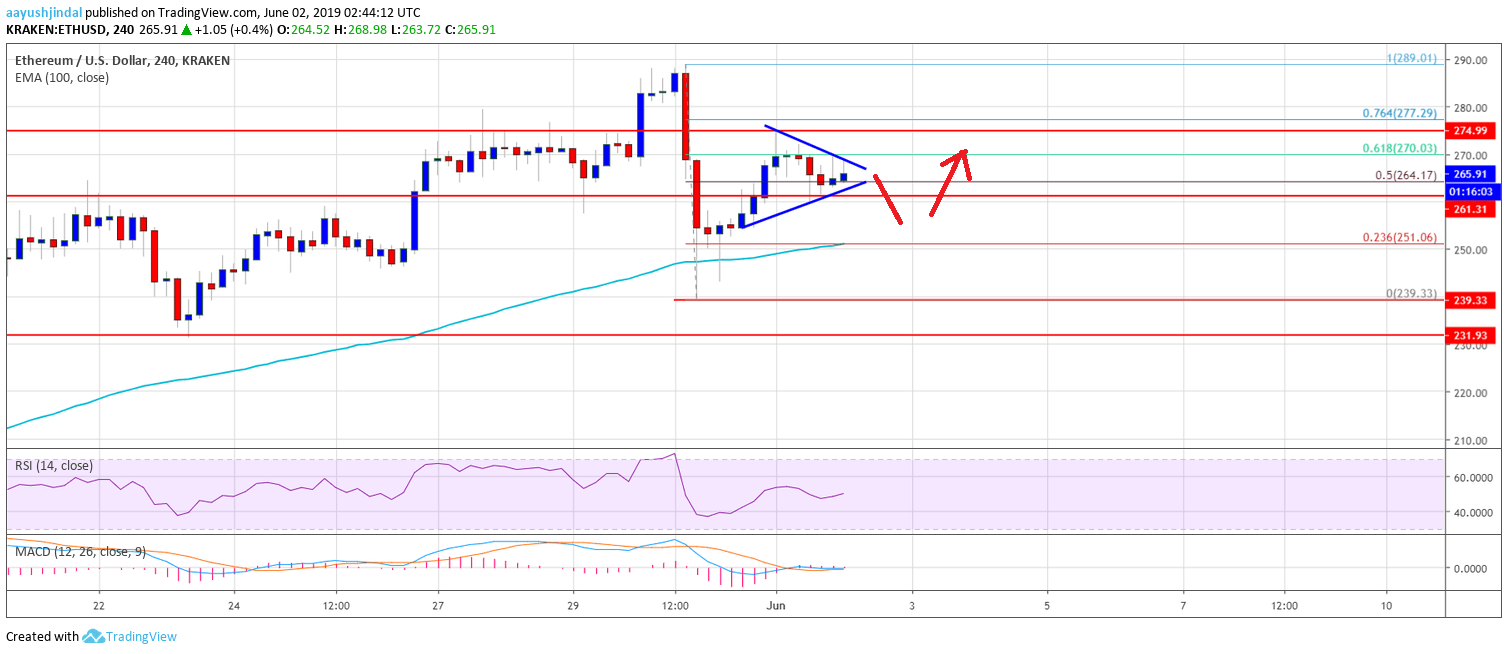
The above chart indicates that Ethereum seems to be consolidating in a tiny range above the $260 support area. To start a fresh increase, the price must break $270 and $280. The next main hurdle for the bulls is near the $300 level.
Technical Indicators
4 hours MACD – The MACD for ETH/USD is slowly moving in the bullish zone.
4 hours RSI – The RSI for ETH/USD is currently just below the 50 level, with a flat structure.
Major Support Level – $250
Major Resistance Level – $280
The post Ethereum (ETH) Price Holding Gains: Key Resistances Nearby appeared first on NewsBTC.
source https://www.tokentalk.co/NewsBTC/ethereum-eth-price-holding-gains-key-resistances-nearby-5cf34ba125e47a2259b277a0
Saturday, 1 June 2019
Ethereum (ETH) Price Holding Gains: Key Resistances Nearby @newsbtc #Analysis #Technical #ETH #ethereum
Subscribe to:
Post Comments (Atom)
This analyst says there’s a “high chance” Bitcoin may never fall under $5k again @cryptoslate #Analysis #Price Watch
Once Bitcoin (BTC) started to incur strong losses in the second half of 2019, analysts were once again making extremely low price prediction...

-
The Indian Ministry of Commerce and Industry announced yesterday that the Coffee Board in the country is integrating blockchain into the cof...
-
App-enabled cryptocurrency exchange and wallet provider, Zebpay, has announced that it is enabling Lightning Network payments for all its ...
-
Once Bitcoin (BTC) started to incur strong losses in the second half of 2019, analysts were once again making extremely low price prediction...


No comments:
Post a Comment