- ETH price recovered recently, but it struggled to clear the $275 resistance against the US Dollar.
- The price is currently under pressure and it could decline below the $260 support area.
- There wa...
- ETH price recovered recently, but it struggled to clear the $275 resistance against the US Dollar.
- The price is currently under pressure and it could decline below the $260 support area.
- There was a break below a major bullish trend line with support at $270 on the hourly chart of ETH/USD (data feed via Kraken).
- The pair is currently showing bearish signs and it could decline towards the $250 support area.
Ethereum price is slowly moving lower versus the US Dollar and bitcoin. ETH price could decline towards the $250 support level before it might climb back above $275.
Ethereum Price Analysis
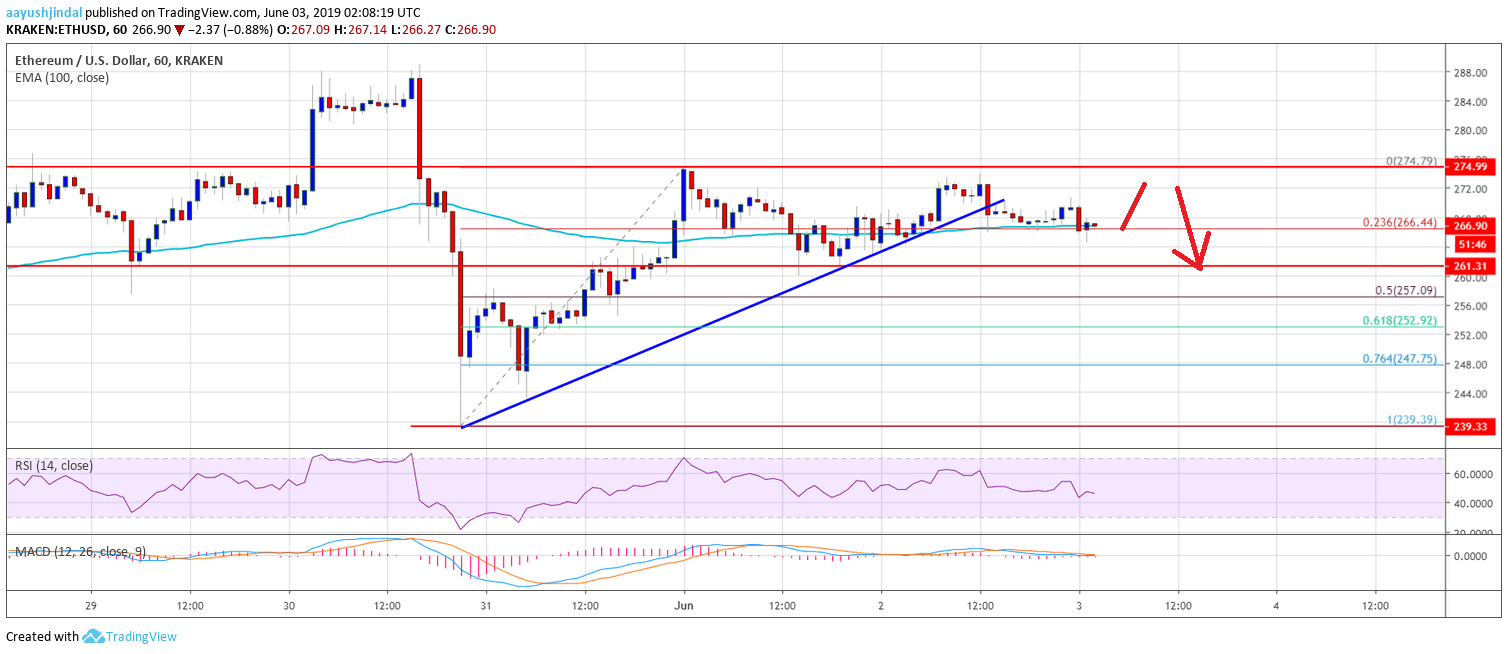
After a strong recovery, Ethereum price struggled to clear the $274 and $275 resistances against the US Dollar. The ETH/USD pair formed a swing high near $275 and recently started trading in a range. It declined below the $272 and $270 support levels. Later, there was another attempt to clear the $274 level, but the bulls struggled to gain momentum. As a result, there was another decline and the price is now trading below the $270 level.
There was a break below a major bullish trend line with support at $270 on the hourly chart of ETH/USD. The pair is currently trading near the $266 level and the 100 hourly simple moving average. Besides, it is testing the 23.6% Fib retracement level of the recent wave from the $239 swing low to $274 high. On the downside, an immediate support is near the $260 level, below which there is a risk of more losses below the $255 level. An intermediate support is near $257 and the 50% Fib retracement level of the recent wave from the $239 swing low to $274 high.
The main support is near the $250 level. If the price fails to stay above the $250 support area, there is a risk of a strong decline. The next stop for sellers could be near $242 and $240. On the upside, the key hurdle for the bulls is near the $274 and $275 levels. If there is an upside break above the $275 level, the price could continue above $280.
Looking at the chart, Ethereum price is showing a few negative signs below the $274 level. Therefore, there is a risk of a short term decline below $260 before the price could start a decent upward move. A proper close above $275 might kick start a move towards the $280 level.
ETH Technical Indicators
Hourly MACD – The MACD for ETH/USD is slowly moving in the bearish zone, with a few negative signs.
Hourly RSI – The RSI for ETH/USD is currently well below the 50 level and it might decline to 40.
Major Support Level – $260
Major Resistance Level – $275
The post Ethereum (ETH) Price Showing Signs of Weakness: $250 Holds Key appeared first on NewsBTC.
source https://www.tokentalk.co/NewsBTC/ethereum-eth-price-showing-signs-of-weakness-250-holds-key-5cf49d2025e47a2259b277cf
Sunday, 2 June 2019
Ethereum (ETH) Price Showing Signs of Weakness: $250 Holds Key @newsbtc #Analysis #Technical #ETH #ethereum
Subscribe to:
Post Comments (Atom)
This analyst says there’s a “high chance” Bitcoin may never fall under $5k again @cryptoslate #Analysis #Price Watch
Once Bitcoin (BTC) started to incur strong losses in the second half of 2019, analysts were once again making extremely low price prediction...

-
The Indian Ministry of Commerce and Industry announced yesterday that the Coffee Board in the country is integrating blockchain into the cof...
-
App-enabled cryptocurrency exchange and wallet provider, Zebpay, has announced that it is enabling Lightning Network payments for all its ...
-
Once Bitcoin (BTC) started to incur strong losses in the second half of 2019, analysts were once again making extremely low price prediction...


No comments:
Post a Comment